Flashes of light may help scientists predict when solar flares may explode from the sun
Researchers used data collected from NASA’s Solar Dynamics Observatory to identify small signals of the sun’s atmosphere that will help to identify which regions on the sun were more likely to produce solar flares.
A view of the Sun on January 16-17, 2023.
(Solar Dynamics Observatory / NASA)
Scientists have been studying solar flares for years and have tried to predict when and where one will explode from the boiling-hot surface of the sun, and now new clues have been discovered that may help with those predictions.
Researchers from the NorthWest Research Associates (NWRA) used data collected from NASA's Solar Dynamics Observatory (SDO) to identify small signals of the sun's atmosphere, the corona, that will help to determine which regions on the sun were more likely to produce solar flares.
A solar flare, according to NASA, is an intense burst of radiation that comes from the release of magnetic energy associated with sunspots.
Scientists found that above the regions of the sun that were about to flare, the corona produced small flashes.
NASA described those flashes as "small sparklers before the big fireworks."
THESE ARE THE 5 CATEGORIES THAT MEASURE GEOMAGNETIC STORMS
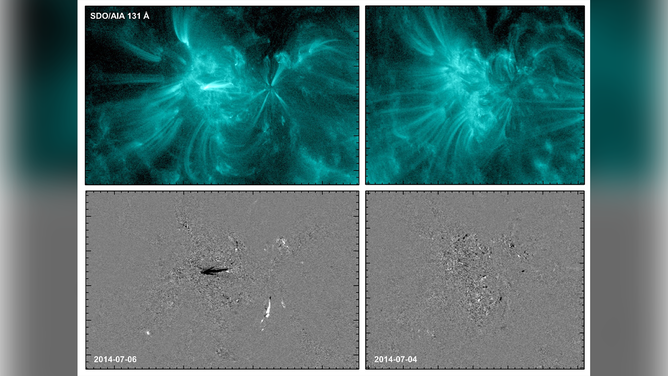
Two images of a solar active region (NOAA AR 2109) taken by SDO/AIA show extreme-ultraviolet light produced by million-degree-hot coronal gas (top images) on the day before the region flared (left) and the day before it stayed quiet and did not flare (right). The changes in brightness (bottom images) at these two times show different patterns, with patches of intense variation (black & white areas) before the flare (bottom left) and mostly gray (indicating low variability) before the quiet period (bottom right).
(NASA/SDO/AIA/Dissauer et al. 2022 / NASA)
This newly-discovered find may eventually help scientists improve their predictions of solar flares and other space weather storms.
Space weather can have a significant impact here on Earth by producing mesmerizing auroras, disrupting radio communications, endangering the lives of astronauts and even causing large-scale blackouts.
IMPROVED SPACE WEATHER FORECASTS NEEDED TO AVOID DESTRUCTION OF SATELLITES
Scientists have been studying solar flares to try and better predict them
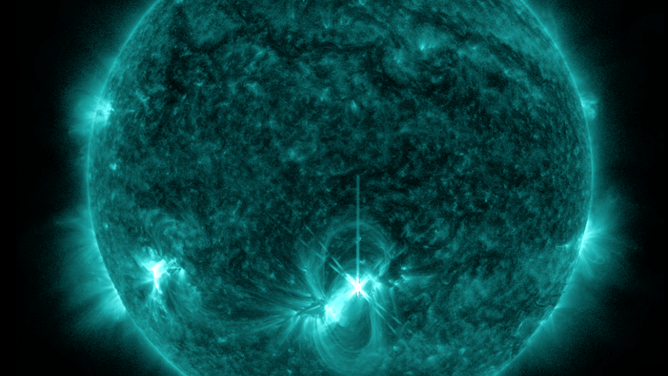
NASA's Solar Dynamics Observatory captured this image of a solar flare – as seen in the bright flash towards the middle of the Sun – on Tuesday, May 10, 2022. The image shows a subset of extreme ultraviolet light that highlights the extremely hot material in flares and which is colorized in teal.
(NASA/SDO)
NASA says scientists have been watching activity in the lower layers of the sun's atmosphere, which can indicate an impending solar flare in active regions.
Those regions, according to NASA, are marked by groups of sunspots.
The findings, published in The Astrophysical Journal, are helping scientists better understand solar flares.
"We can get some very different information in the corona than we get from the photosphere, or 'surface' of the sun," KD Leka, lead author on the new study, who is also a designated foreign professor at Nagoya University in Japan, said in a news release. "Our results may give us a new marker to distinguish which active regions are likely to flare soon and which will stay quiet over an upcoming period of time."
NASA said that the scientists used a newly-created image database of the sun's active regions captured by the SDO for their research. The database has eight years of images that were taken above the active areas in ultraviolet and extreme-ultraviolet light.
WHAT IS THE 11-YEAR SOLAR CYCLE?

FILE - NASA's SDO captured this image of a mid-level solar flare, an M5.6-class, on Aug. 24, 2015.
(Solar Dynamics Observatory / NASA)
According to NASA, the new database makes it easier for scientists to use data from the Atmospheric Imaging Assembly (AIA) on SDO for large-scale studies.
"It's the first time a database like this is readily available for the scientific community, and it will be very useful for studying many topics, not just flare-ready active regions," Karin Dissauer said.