US heating demand typically surpasses cooling demand after autumnal equinox
The calculation of heating degree days and cooling degree days is widely used in the energy industry. The U.S. Energy Information Administration reports that the region encompassing the Northern Plains typically has the largest number of heating degree days, while the Southern Plains and Lower Mississippi Valley have the largest number of cooling degree days.

Fall outlook shows us what to expect in US this autumn
The official fall weather outlook from NOAA's Climate Prediction Center says most of the U.S. will see a warm, dry autumn.
Americans use more energy for heating and cooling their homes than for any other aspect of life. Typically, when a day’s average temperature falls below 65 °F, homeowners turn up the heat, while if the temperature rises above 65 °F, air conditioning becomes the preferred choice.
The energy sector commonly uses 'heating degree days' (HDDs) and 'cooling degree days' (CDDs) to quantify the resources needed to maintain comfort throughout the year.
An HDD is calculated by determining how many degrees the temperature drops below 65 °F. For instance, a day with an average temperature of 65 °F is considered to have zero HDDs, whereas a day with an average temperature of 50 °F is assigned 15 HDDs.
Conversely, a CDD measures how much the average temperature exceeds 65 °F. For example, a day with an average temperature of 77 °F is considered to have 12 CDDs, while a day with an average temperature of 90 °F would accumulate 25 CDDs.
According to the U.S. Energy Information Administration, the average number of HDDs in the U.S. typically ranges from 3,700 to 4,700 per year, whereas CDDs generally range from 1,200 to 1,600 annually.
SAVE MONEY ON YOUR ENERGY BILL THIS WINTER BY FOLLOWING THESE SIMPLE TIPS
For example, in Minneapolis - a city known for its cold climate - the local observation site recorded 944 HDDs in December 2023 and 291 CDDs during the past July.
From these figures alone, a layperson can infer that winter’s cold had a far greater impact than the summer’s warmth.
Consequently, residents’ utility bills were likely much higher during the winter due to the increased energy required for heating homes and businesses.
In contrast, a warm, sunny climate like that of Miami shows a much different correlation.
The city recorded only 8 HDDs in December but accumulated 647 CDDs in July, nearly double the number seen in Minneapolis. So, one can infer, that heating bills in South Florida are insignificant when compared to the stifling heat during the summer months.
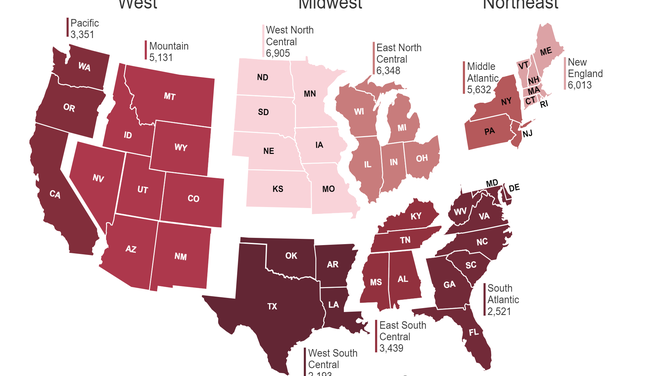
According to the U.S. Energy Information Administration, the West North Central division - which includes North and South Dakota, Nebraska, Kansas, Minnesota, Iowa and Missouri - typically has the highest number of days that require heat. In 2022, this region recorded 6,905 HDDs, about 600 more than the next highest region.
![Heating Degree Day]() Image 1 of 2
Image 1 of 2Heating Degree Day (EIA)
![Cooling Degree Day map]() Image 2 of 2
Image 2 of 2Cooling Degree Day map (EIA)
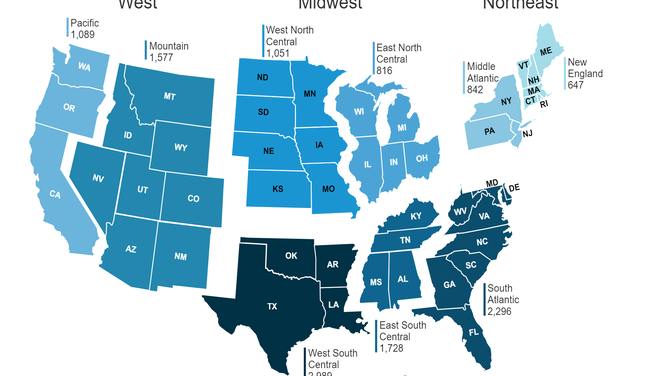
Conversely, the West South Central division had the most cooling degree days, with a total of 2,989, surpassing other regions such as the Southeast, Tennessee Valley and Mountain West, which ranked second, third and fourth, respectively.
The change, from when the country’s CDDs fall below the rate of HDDs, usually takes place a week or two past the Northern Hemisphere’s autumnal equinox, but some specialists have been noticing a changing trend.
ANTARCTICA’S ‘DOOMSDAY GLACIER’ IS MELTING AWAY DIFFERENTLY THAN SCIENTISTS FIRST THOUGHT
Climate change leading HDDs to drop while CDDs rise
The Environmental Protection Agency has observed an increase in CDDs while the number of HDDs per year has been declining. According to the agency, HDDs have decreased by just over four degree days annually, while CDDs have risen by nearly two degree days per year.
A 1% decrease in HDDs is expected to lead to a 1% reduction in fuel demand, meaning that if supplies remain constant, this could gradually reduce winter heating bills. However, the increase in CDDs may offset some of the savings from milder winters, but industry experts note that the change is not occurring uniformly across all regions.
In a study published in the journal Nature, authors Yana Petri and Ken Caldeira found that cooler climates are anticipated to experience only a modest increase in CDDs, while warmer areas will see a significant rise. Conversely, regions with high HDDs are expected to experience a notable decrease, while areas with already low HDDs will see only a slight reduction.
"Under the unmitigated RCP8.5 [Representative Concentration Pathway 8.5, an expectation that represents a high level of global warming], by the end of this century, in terms of HDD and CDD values considered separately, future New York, NY, is anticipated to become more like present Oklahoma City, OK; Denver, CO, becomes more like Raleigh, NC and Seattle, WA, becomes more like San Jose, CA," the authors stated.

Heating degree days versus cooling degree days
(EPA / FOX Weather)